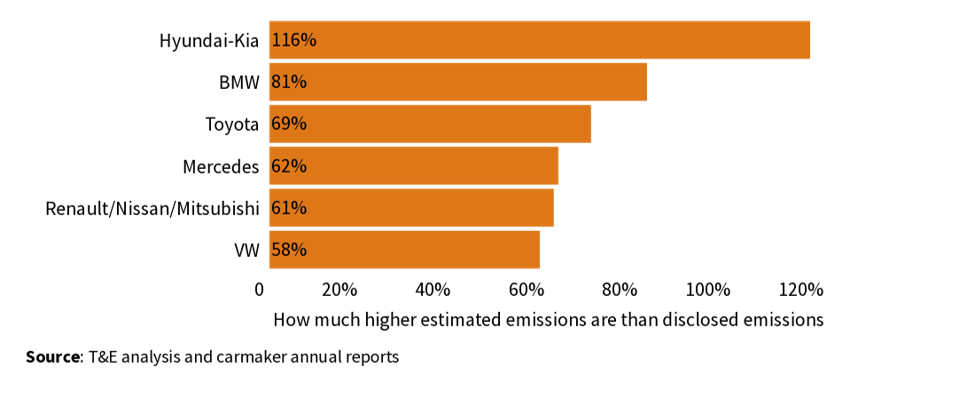
Carmakers’ global emissions are on average 50% higher than what they report with Hyundai-Kia and BMW underreporting emissions by as much as 115% and 80% respectively, a new Transport & Environment (T&E) report shows. With obligatory scope 3 (lifetime) emissions disclosure set to be introduced in 2023, asset managers with exposure to carbon intensive carmakers face a ‘ticking carbon bomb’, says T&E.
In 2023, the EU will introduce a requirement that financial institutions disclose their scope 3 emissions (indirect emissions)[1]. The new requirement will hit asset managers with exposure to carmakers hard. Unlike manufacturers of furniture or mobile phones, the vast majority (98%) of a car company’s emissions come under scope 3 – primarily the use of the cars [2].
But, as T&E’s analysis shows, carmakers’ already high scope 3 emissions are likely far larger than officially reported.
Luca Bonaccorsi, director of sustainable finance at T&E, said: “For green investing to be effective, we need accurate data. Carmakers are trying to pull the wool over investors eyes by underreporting the lifetime emissions of their cars. This makes a mockery of carmakers’ green claims.”
Carmakers base their total reported emissions on a number of factors such as the average size of the vehicles, where the cars are driven and the lifespan of vehicles. Carmakers on the whole have used selective data to reach a lower figure. Toyota, for example, bases the lifetime average emissions of its vehicles on a scarcely believable 100,000 kilometres.
This makes car companies, from an investment perspective, almost as carbon intensive as the oil industry. At today’s prices, €1 million invested in an average of oil giants Exxon Mobil, BP and Shell finances around 5,000 tonnes of CO2 equivalent (CO2e). The same amount finances more than 4,500 tCO2e in the car sector[3]. In some cases the carbon intensity of carmakers is significantly higher: nearly 10,000 tonnes if invested in Renault-Nissan-Mitsubishi and 7,000 tonnes for Honda according to carmakers’ reporting [4].
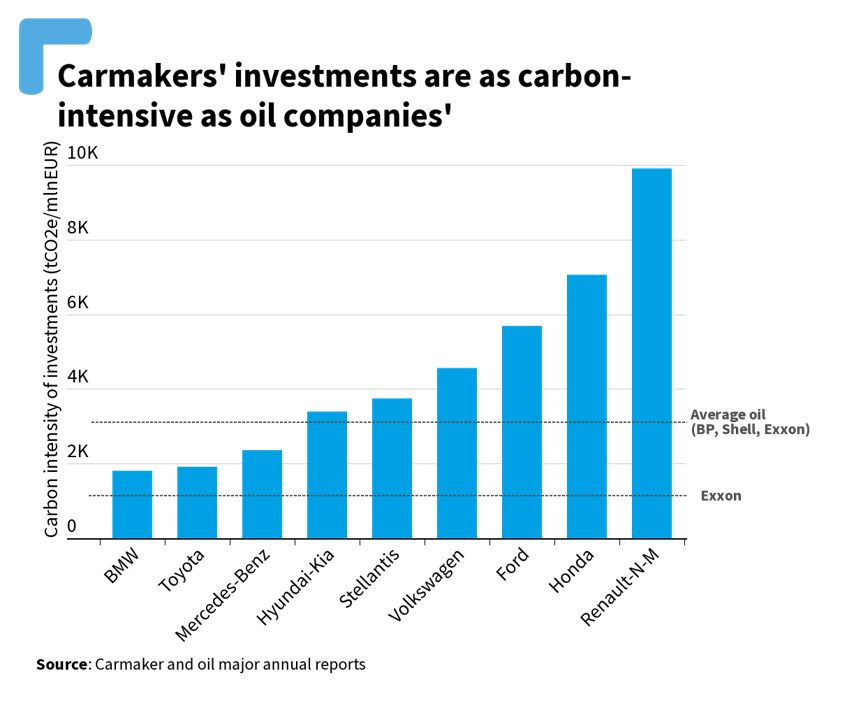
Luca Bonaccorsi added: “According to official disclosures, a euro invested in a car company finances virtually the same amount of carbon as a euro in an oil company. This should be a wake up call for the financial industry. Asset managers wanting to avoid a ticking carbon bomb will have to start ditching carmakers that continue to sell polluting cars.”
By the end of 2022, Morningstar, a US-based financial firm, estimates that some 50% of all new financial products sold will be environmental, social and governance (ESG) based. However, ESG ratings fail to capture the companies’ true climate impact. Despite CO2 emissions being the most important environmental indicators, they represent less than 1% of the ESG rating for S&P and MSCI, two of the world’s leading ESG indexes. T&E calls on the EU to regulate and harmonise the methodology for ESG ratings to ensure consistent and transparent reporting of data.
ENDS
Notes to editor
[1] Car companies’ true carbon intensity will be revealed in 2023 thanks to mandatory Scope 3 disclosure (both in the Sustainable Finance Disclosure Regulation and in the Corporate Sustainability Reporting Directive).
[2] Greenhouse gas emissions are categorised into three groups (Scopes) by the most widely-used international accounting tool, the Greenhouse Gas (GHG) Protocol. Scope 1 covers direct emissions from owned or controlled sources. Scope 2 covers indirect emissions from the generation of purchased electricity, steam, heating and cooling consumed by the reporting company. Scope 3 includes all other indirect emissions that occur in a company’s value chain.
[3] This is based on the official scope 3 disclosures of carmakers and oil companies, not T&E’s estimates. Oil companies are likely also significantly underreporting their scope 3 emissions. However, we have no evidence to believe that the under-reporting is higher in any specific sector. On the contrary, in another analysis, evidence suggests the error must be rather homogeneous across sectors and is somewhat filtered out by the use of ratios.
[4] The chart does not compare companies’ total emissions but the amount of emissions equivalent to a specific financial investment. This ratio is influenced by the appetite of the market for a specific company, so the higher the evaluation of the company, the lower the carbon intensity ratio. A company’s evaluation is affected by a large number of variables.


