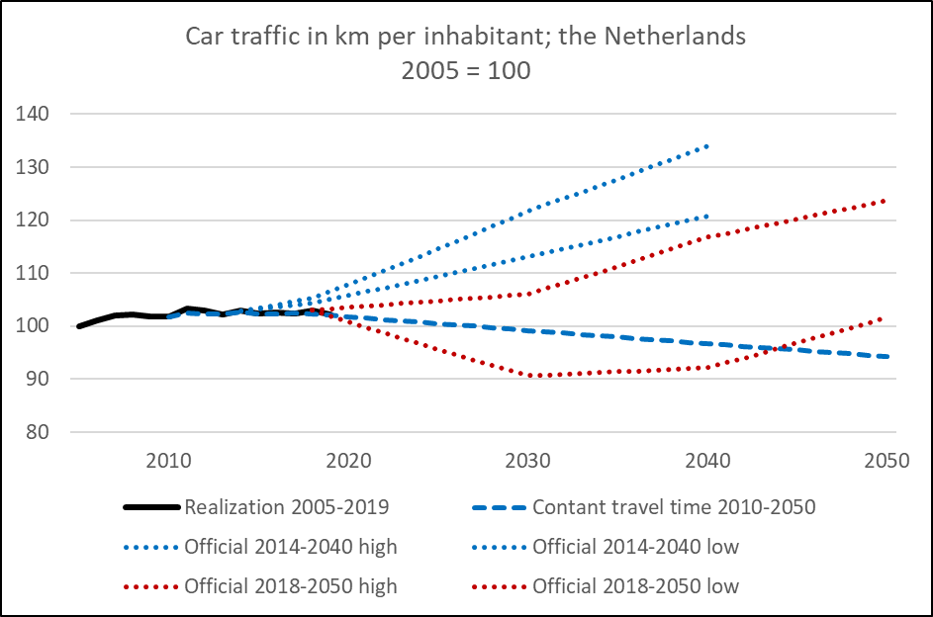
Last year the Dutch government published far lower projections for car growth than what it had predicted back in 2017. Its upper projection for 2040 was halved, from 27% growth to 13%, while its lower projection even predicts a decline in car traffic per inhabitant of 11% between 2018 and 2040.
The graph shows the outdated and new official projections. The reason for this correction is that the former 2014-2040 forecasts were clearly too high. Car traffic was in 2019 – pre-Covid – even more than 3% beneath its low variant for the same year. Too bad that building new highway capacity was decided based on these unrealistic forecasts.
Transport ministries plan future infrastructure investments based on growth projections claiming new capacity is needed to absorb new traffic demand. As a result, it was decided to expand highway capacity. It is now clear these projections were inaccurate.
Why were the traffic forecasts for the Netherlands too high? Could this also be the case in other countries?
Most mobility projections do not take due account of the limits in the amount of time people are willing to travel. Throughout history, both in affluent and developing countries, people travel on average somewhere around 70 minutes per day. This sets a cap on mobility growth.
In my book New Mobility – beyond the car era, I explain this approach, and I elaborate on the consequences for policymaking of this ‘law of constant travel time’. Starting from this rule, I also made a forecast from 2010 till 2050, showing a gentle decline in car traffic per inhabitant. My projection is added to the graph and is pretty accurate between 2010 and 2019.
Comparing my estimate with the upper Dutch projection, reveals a major difference. And again, this is caused by neglecting the importance of travel time. The high forecast assumes that people will on average spend 32% more time driving a car in 2050 than in 2018. However, the time spent car driving per inhabitant has annually declined by 1% in the years 2010-2017 (Dutch statistics). The recent high forecast from the Dutch government is clearly unrealistic, and in conflict with the ‘law of constant travel time’.
Other countries might also have to cope with unrealistic forecasts in the growth of car traffic. My analysis, above, applies to high-income countries with a mature motorway network. If you want to check whether the car traffic projections in your country are realistic, just ask for the associated travel time data, and compare these with recent statistics and judge their consistency with constant travel time.
You can find an example in the table on this webpage. Doing the travel time check can prevent uneconomic building of new motorway capacity. This prevents extra traffic growth, pollution and suburbanisation.

